

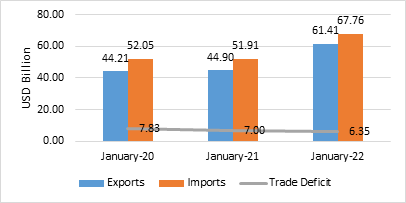
India’s overall exports (Merchandise and Services combined) in January 2022* are estimated to be USD 61.41 Billion, exhibiting a positive growth of 36.76 per cent over the same period last year and a positive growth of 38.90 per cent over January 2020. Overall imports in January 2022* are estimated to be USD 67.76 Billion, exhibiting a slower rate of growth of 30.54 per cent over the same period last year and a positive growth of 30.19 per cent over January 2020
Table 1: Trade during January 2022*
|
|
|
January 2022 (USD Billion) |
January 2021 (USD Billion) |
January 2020 (USD Billion) |
Growth vis-à-vis January 2021 (%) |
Growth vis-à-vis January 2020 (%) |
|
Merchandise |
Exports |
34.50 |
27.54 |
25.85 |
25.28 |
33.45 |
|
Imports |
51.93 |
42.03 |
41.15 |
23.54 |
26.19 |
|
|
Trade Balance |
-17.42 |
-14.49 |
-15.30 |
-20.23 |
-13.91 |
|
|
Services* |
Exports |
26.91 |
17.37 |
18.36 |
54.95 |
46.57 |
|
Imports |
15.83 |
9.88 |
10.90 |
60.32 |
45.33 |
|
|
Net of Services |
11.07 |
7.49 |
7.46 |
47.86 |
48.38 |
|
|
Overall Trade (Merchandise+ Services)* |
Exports |
61.41 |
44.90 |
44.21 |
36.76 |
38.90 |
|
Imports |
67.76 |
51.91 |
52.05 |
30.54 |
30.19 |
|
|
Trade Balance |
-6.35 |
-7.00 |
-7.83 |
9.30 |
18.92 |
* Note: The latest data for services sector released by RBI is for December 2021. The data for January 2022 is an estimation, which will be revised based on RBI’s subsequent release. (ii) Data for 2019, 2020 and April to September 2021 are revised on pro-rata basis using quarterly balance of payments data.
Fig 1: Overall Trade during January 2022*
- India’s overall exports (Merchandise and Services combined) in April-January 2021-22* are estimated to be USD 545.71 Billion, exhibiting a positive growth of 37.68 per cent over the same period last year and a positive growth of 23.29 per cent over April-January 2019-20. Overall imports in April-January 2021-22* are estimated to be USD 616.91 Billion, exhibiting a positive growth of 54.35 per cent over the same period last year and a positive growth of 20.15 per cent over April-January 2019-20.
Table 2: Trade during April-January 2021-22*
|
|
|
April-January 2021-22 (USD Billion) |
April-January 2020-21 (USD Billion) |
April-January 2019-20 (USD Billion) |
Growth vis-à-vis April-January 2020-21 (%) |
Growth vis-à-vis April-January 2019-20 (%) |
|
Merchandise |
Exports |
335.88 |
228.92 |
264.13 |
46.73 |
27.17 |
|
Imports |
495.75 |
304.79 |
405.33 |
62.65 |
22.31 |
|
|
Trade Balance |
-159.87 |
-75.87 |
-141.21 |
-110.71 |
-13.21 |
|
|
Services* |
Exports |
209.83 |
167.45 |
178.49 |
25.31 |
17.56 |
|
Imports |
121.16 |
94.88 |
108.13 |
27.69 |
12.05 |
|
|
Disclaimer : All the information on this website is published in good faith and for general information purpose only. www.newsagencyindia.com does not make any warranties about the completeness, reliability and accuracy of this information. Any action you take upon the information you find on this website www.newsagencyindia.com , is strictly at your own risk RELATED NEWS |